At Hexagone Metrics, IT developers and financial analysis work hand in hand to ensure investors can visualise their portfolio in as much detail as possible.
At Hexagone Metrics, IT developers and financial analysis work hand in hand to ensure investors can visualise their portfolio in as much detail as possible.
A limited appetite for risk
We clearly prefer measuring it. We have therefore developed tools that can calculate the underlying financial and extra-financial risks of our clients’ portfolios with a great deal of precision.
We clearly prefer measuring it. We have therefore developed tools that can calculate the underlying financial and extra-financial risks of our clients’ portfolios with a great deal of precision.
One portfolio, one report
All requests are different. All portfolios are different. We adapt to each of our investors to provide the report that is best suited to their needs.
All requests are different. All portfolios are different. We adapt to each of our investors to provide the report that is best suited to their needs.
Hexagone Metrics is a leading reporting service dedicated to institutional investors. Our team brings together data specialists, financial market experts, and IT developers to provide you with the most detailed view possible of your portfolio. To do so, we have developed a powerful tool that feeds several reporting services and covers three key aspects: performance, risk and ESG.
Our reporting services provide an exhaustive view of all your investments – including listed products, non-listed assets, and real estate. The result is a clear picture of performances and risks.
Hexagone Metrics Our difference
Technology
Our relational databases collect and centralise huge volumes of interconnected data drawn from various sources. Our proprietary algorithms check and enhance this data to enable the execution of complex calculations based on our in-house models.
Tailor-made
To address our investors’ individual needs, Hexagone Metrics offers a tailor-made report designed to facilitate decision-making or portfolio analysis. We based our work on technology-driven algorithms to produce reliable gross data. However, this data is then reworked to provide the information that will meet your specific needs: explanatory risk report, technical decision-making tool, detailed performance report… Our goal is to ensure you are free to focus on essentials: managing your portfolio.
Experience
Launched in 2013, we are a leading player in the institutional investment space. We leverage on our proven knowledge of the institutional world and on our exhaustive expertise, spanning all investment-related and portfolio management issues. This permanent contact enables us to continually upgrade our reporting tools to better serve your needs.
The services
1. Performances
Offering a clear overview of the returns generated by all investments
Aggregate performances
Providing you with a consolidated view of the total returns generated by your portfolio, for each individual asset class.
Performance of listed products
A precise calculation of the financial returns delivered by all listed products, accounting for fluctuating valuations caused by market movements and the financial characteristics of each product.
Performance of unlisted products
We calculate the performance of your unlisted investments – debt or equity – allowing for the specific features of these products. You are informed of the value created by your investments over a period of your choice.
2. Risks
Tier 1 risks
We calculate the standard portfolio risk metrics: volatility, Sharpe ratios, max. drawdowns, VaR. These ratios are recalculated for your portfolio based on its components and on any movements that took place during the period under review.
Look-through reporting
A granular breakdown of all positions held by underlying funds for an accurate and detailed view of the allocation and risk exposure of your portfolio.
Regulatory ratios (SCR, COREP...)
We measure your regulatory ratios using our in-house models.
Stress tests
We make return forecasts for your portfolio using scenarii based on the different market variables that affect the products in which you have invested.
3. ESG
Quantify your ESG approach, objectively
Standardised ESG rating
We determine ESG ratings by examining portfolio inventories and using unique and homogenous data to facilitate readability and disclosure.
Carbon footprint
We calculate the volume of greenhouse gas emissions produced by the companies held in your portfolio to determine the total carbon footprint, carbon intensity or emissions financed.
Global or tailor-made detailed ESG analysis
Beyond simple ESG or carbon ratings, we may also select your preferred metrics together – whether regulatory (alignment with European Taxonomy, portfolio climate pathway) or internal (tracking specific information aligned with your own set objectives).
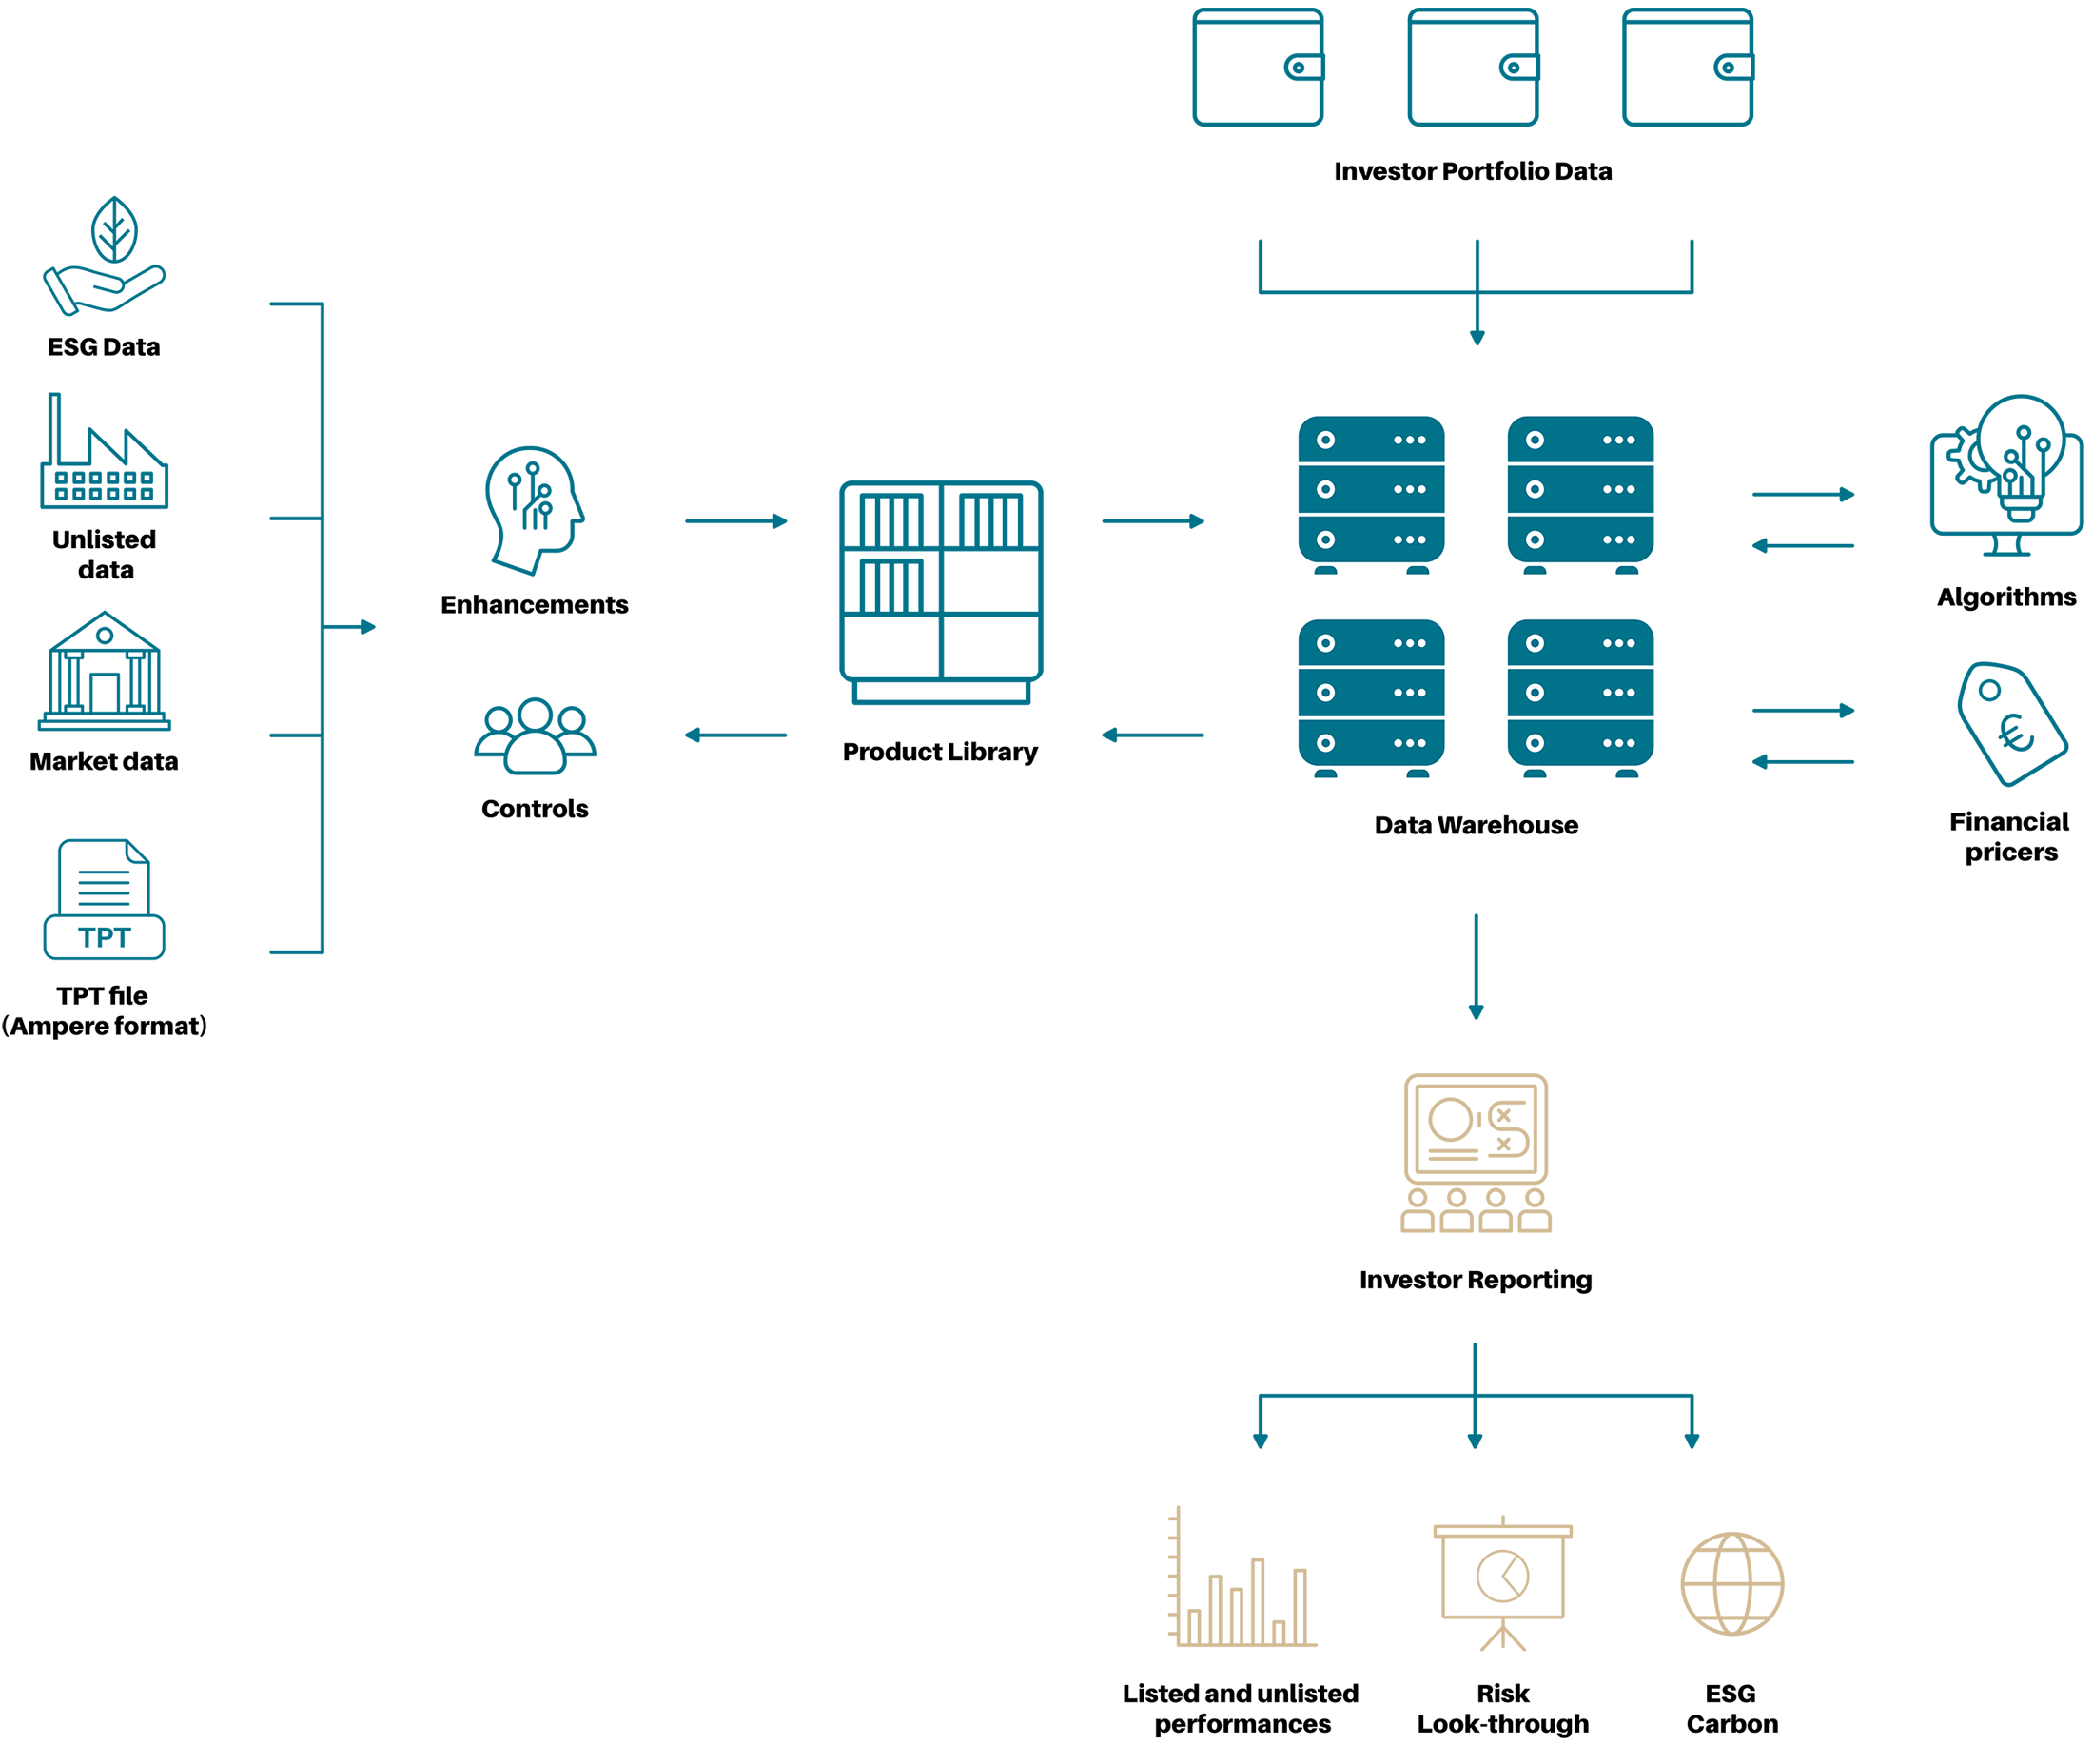
Metrics Architecture
All applications and data are hosted in the Cloud on dedicated servers located in France. They benefit from the SecNumCloud accreditation, a security visa delivered by the French Agence Nationale de la Sécurité des Systèmes d’Information, which guarantees the highest standard of security available for sensitive and strategic data.
Hexaconso
Watch this short video to find out more on our financial data “look-through” reporting tool